Analytics
The Analytics section provides comprehensive insights into class and student performance, helping you make data-driven teaching decisions.
Accessing Analytics
- Click "Analytics" in the sidebar navigation
- View performance dashboards and reports
Analytics Overview
Dashboard Summary
The main dashboard shows:
- Overall class performance
- Key metrics at a glance
- Trend indicators
- Areas requiring attention
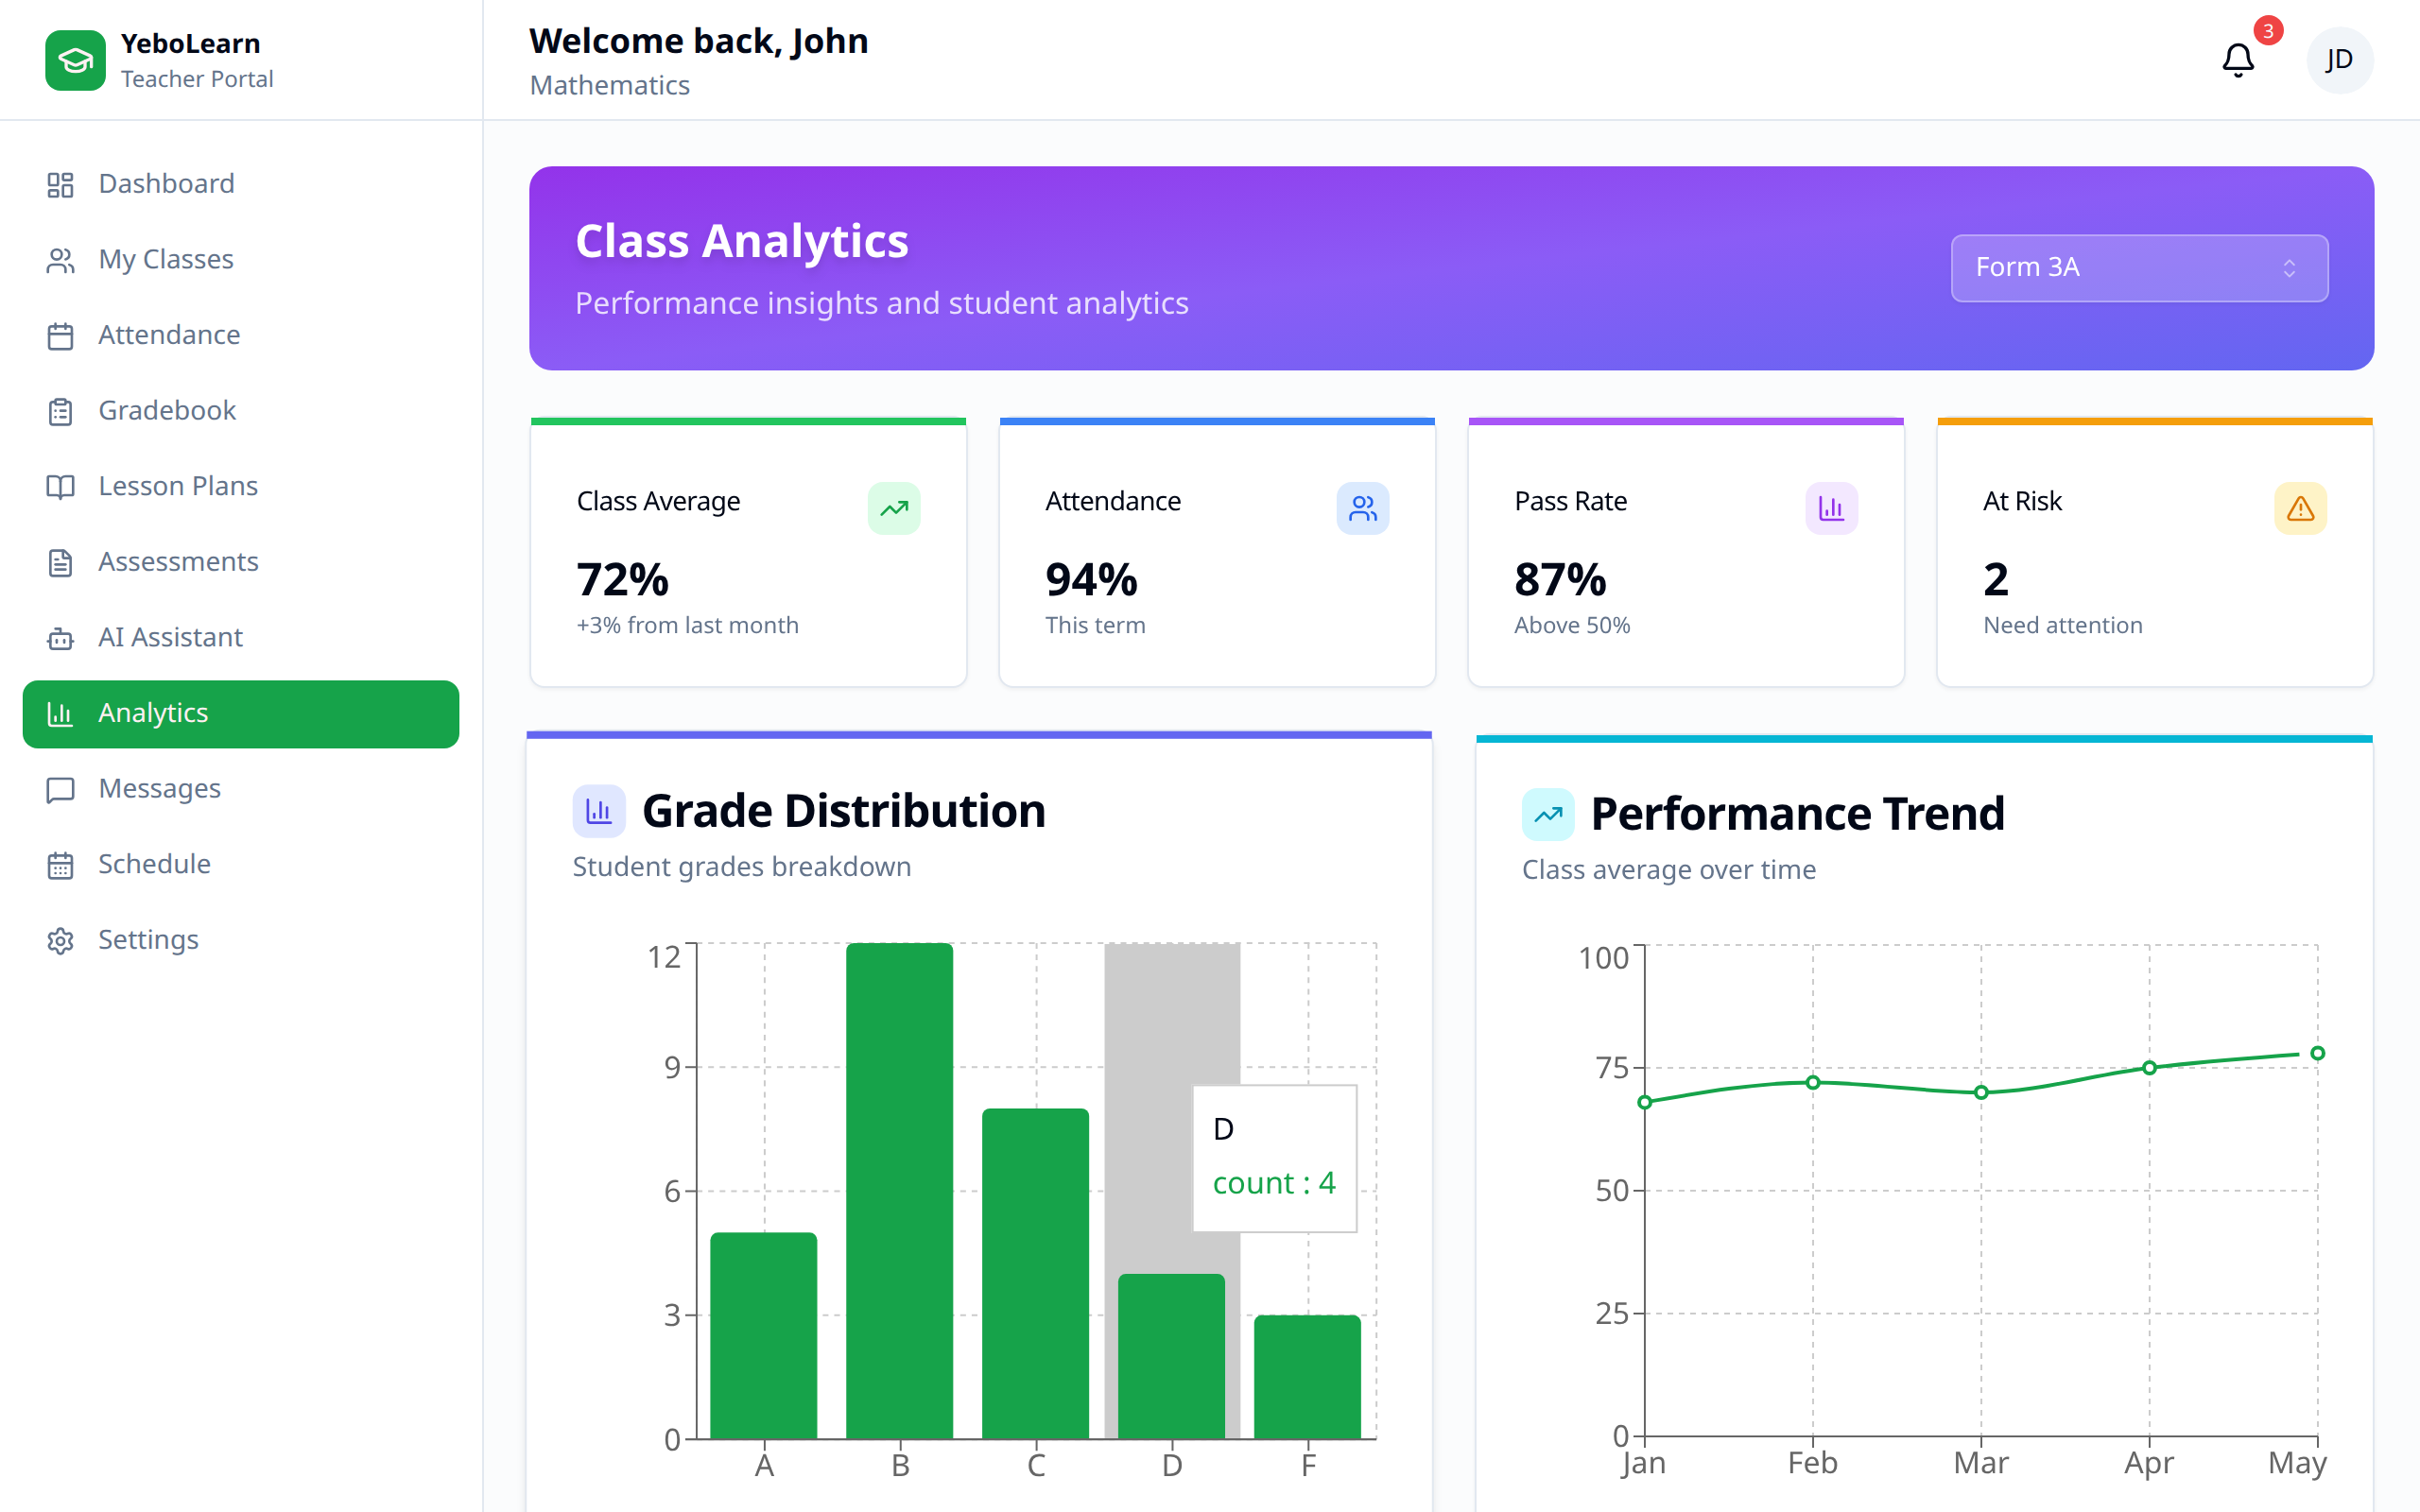
Class Analytics
Class Performance
For each class, view:
| Metric | Description |
|---|---|
| Class Average | Overall grade average |
| Attendance Rate | Percentage attendance |
| Pass Rate | Students passing threshold |
| Improvement | Trend over time |
Grade Distribution
See how grades are distributed:
- Bar chart or pie chart
- Number of students per grade range
- Identify patterns
- Compare to expectations
Performance Trends
Track performance over time:
- Line graph showing averages
- Week-by-week or month-by-month
- Identify improving/declining trends
- Spot seasonal patterns
Student Analytics
Individual Performance
View each student's:
- Current grade/average
- Grade trend over time
- Attendance pattern
- Assessment scores
- Strengths and weaknesses
Comparative Analysis
Compare students:
- Rank by performance
- Identify top performers
- Find struggling students
- Group by performance level
At-Risk Students
Automatically identify students who:
- Have declining grades
- Miss too many classes
- Have incomplete assignments
- May need intervention
Assessment Analytics
Assessment Performance
For each assessment:
- Class average score
- Score distribution
- Highest and lowest scores
- Completion rate
Question Analysis
For detailed assessments:
- Question-by-question performance
- Most missed questions
- Average time per question
- Identify difficult concepts
Assessment Comparison
Compare across assessments:
- Difficulty levels
- Score trends
- Student improvement
Attendance Analytics
Attendance Patterns
Analyze attendance data:
- Overall attendance rate
- Day-of-week patterns
- Individual student patterns
- Seasonal variations
Attendance vs. Performance
Correlate attendance with grades:
- See relationship between attendance and grades
- Identify impact of absences
- Support intervention decisions
Generating Reports
Report Types
Available reports:
| Report | Contents |
|---|---|
| Class Performance | Overall class metrics |
| Student Progress | Individual student analysis |
| Assessment Analysis | Detailed assessment data |
| Attendance Report | Attendance statistics |
| Term Report | Comprehensive term summary |
Creating Reports
- Click "Generate Report"
- Select report type
- Choose class/students
- Select date range
- Click "Generate"
- Download or print
Scheduling Reports
Set up automatic reports:
- Weekly summaries
- Monthly performance updates
- Term-end reports
Using Analytics Effectively
Inform Teaching
Use data to:
- Identify topics needing review
- Adjust pacing
- Differentiate instruction
- Focus on struggling students
Parent Communication
Share analytics with parents:
- Student progress reports
- Performance trends
- Attendance concerns
- Improvement plans
Administrative Reporting
Provide data for:
- School performance reviews
- Curriculum evaluation
- Resource allocation
- Intervention planning
Dashboard Customization
Widgets
Add or remove dashboard widgets:
- Class averages
- Attendance summaries
- Recent grades
- Alert notifications
Filters
Apply filters to view:
- Specific classes
- Date ranges
- Assessment types
- Student groups
Best Practices
- Review regularly - Check analytics weekly
- Act on insights - Use data to drive decisions
- Share findings - Communicate with stakeholders
- Track interventions - Monitor impact of changes
- Look for patterns - Identify recurring issues
- Celebrate success - Recognize improvements
TIP
Use analytics to prepare for parent-teacher conferences with specific, data-backed insights about each student.